Keepin’ An Eye on KPIs: The Rule of 40 Recast
You like to exaggerate, dream and imaginate
Then change the rhyme around, that can aggravate me - Eric B. & Rakim, I Ain’t No Joke
Another day, another key performance indicator (KPI). We’ve noticed a pick-up in questions from clients on KPIs, which makes sense considering the wide variety of KPI’s out there, like NR3, ARR, TCV, ACV, ARPU, CSS and OE to name a few. Plus, the difficulty investors have in trying to tie them back to typical financial metrics like earnings, revenue, and cash flow along or comparing them across peers as companies define what sound like the same KPI’s differently.
 Heck even the letters in the acronyms stand for different things, take ARR, is it annual run rate, annualized renewal run-rate, annual run-rate revenue, annualized exit monthly recurring subscriptions (should probably be AEMRS), annualized recurring revenue, annualized recurring run-rate, or the most popular annual recurring revenue, etc. We have an idea, for those companies looking to have their KPI’s really stand out, why not base them off slang terms, for example, SKIBIDI (Sales Keep Improving Business Is Doing Incredible) or Star Wars characters, C3PO (Cumulative Positive Profit Potential is Outstanding)?
We have no problem with KPIs that are determined consistently (but make clear when changes have been made and why) and are defined clearly (which might even allow us to recalculate the KPI and tie it out to the financial statements/footnotes). Ideally, the KPIs provide some incremental insight into the underlying economics of the business, are a leading indicator of how the business is progressing, allow for comparisons with peers and are aligned with creating shareholder value.
That said, red flags go up when we see KPIs that shape shift over time, which are defined poorly and seem to be more about painting a pretty picture of the business than best depicting what is really going on.
We’re kicking off our series of reports on KPIs by focusing on the software as a service (SaaS) favorite, the Rule of 40. Which states that a healthy SaaS company’s revenue growth rate plus “profit” margin should add up to 40% or more (above 40% is “awesome”). After doing this analysis, we’ve been wondering how much that “late-stage investor” thought about stock comp when he dreamt up the Rule of 40, maybe it should have been the Rule of 30 instead.
Rethinking the Rule of 40
Even a simple metric like the Rule of 40 can be calculated in a variety of different ways. For example, some companies use the growth in total revenue, others use the growth in annual recurring revenue, monthly recurring revenue, etc. When it comes to measuring “profitability”, we’ve come across a variety of “profit” margins being used, including non-GAAP operating, adjusted EBITDA, free cash flow, adjusted free cash flow, etc.
For our purposes and to put companies on a level playing field we start by calculating the Rule of 40 as the sum of the YoY growth rate in total revenue plus the free cash flow (cash flow from operations less capex) margin (using the most recent reported last twelve months). We refer to this metric as the “traditional” Rule of 40 or the one based on reported FCF. Next we calculate a revised Rule of 40 by making just one adjustment to the traditional metric, we reduce free cash flow by the amount of stock based comp (SBC) cost (i.e., we’re not giving companies credit for the SBC cost addback to operating cash flow) to arrive at an SBC adjusted free cash flow and free cash flow margin that we use in our SBC adjusted Rule of 40 which is then compared against the traditional metric.
We know what you’re thinking, why adjust a cash flow measure for a “non-cash” cost? Because the cash flow statement misses the mark with stock comp in a variety of ways as highlighted in prior pieces (leases too, but that’s for another day). For example, we think the addback for SBC cost that is currently in the operating section of the cash flow statement, should actually go to the financing section, which would reduce operating cash flow and free cash flow (total cash flows remain the same). That’s because stock comp is two transactions jammed into one: compensation paid to employees (operating) and a financing transaction with employees.
To put this a bit differently, think about the cash flow consequences if the company were to raise equity (financing cash inflow) and use the proceeds to pay its employees (operating cash outflow). Why does simply removing the middleman and handing the shares directly to the employees result in a completely different impact on the cash flow statement?
Rule of 40 Quality Check
 Whether or not you agree with how we’d suggest treating stock comp, our analysis may provide some insight into the quality of the Rule of 40 results. The closer the traditional Rule of 40 amounts are to our SBC adjusted ones the more it appears to be driven by the underlying business, the higher the quality of the metric, all else equal. On the other hand, the wider the gap between the traditional and SBC adjusted Rule of 40 amounts the more it appears to be driven by financial engineering (i.e., how employee compensation is financed), the lower the quality. Which then begs the question (for you to answer), if what appears to be an impressive Rule of 40 result is built on the back of financial engineering does that deserve a lower multiple?
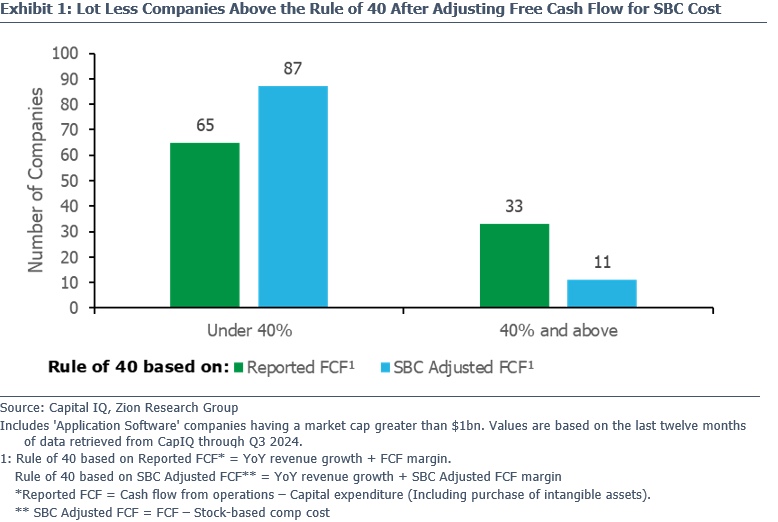
 We applied our thought process to each of the 98 (North American) Application Software companies with a market cap greater than $1 billion. As you can see in Exhibit 1 the number of companies meeting or beating the Rule of 40 drops from 33 (nearly 34% of the total) to just 11 (only 11% of the total). Don’t hesitate to reach out to us if you’re interested in seeing the list of those 11 companies that meet the Rule of 40 under both methods.
What is Driving the Rule of 40 Result: The Underlying Business or Financial Engineering?
When we drill down to individual companies, the impact on the Rule of 40 of our SBC cost adjustment to free cash flow varies considerably, from spreads between the two metrics that are thousands of basis points apart (indicating lower quality) to just a 29-basis point drop for ENGH from 39.3% to 39% (less stock comp in Canada?).
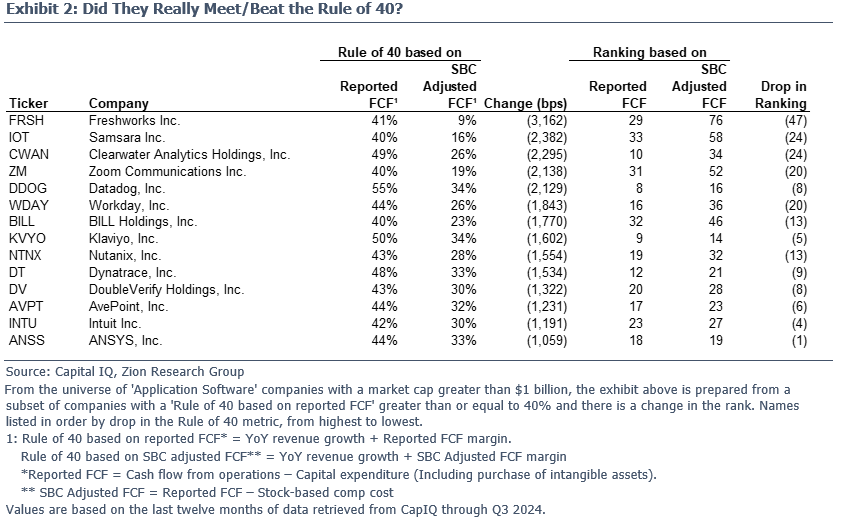
Zeroing in on the 22 companies that had previously met/beat the Rule of 40 that dropped under 40% after our adjustment, we found that 14 of them (listed in Exhibit 2) also experienced a drop in their Rule of 40 ranking against our universe of Application Software companies. Notice for some, like ANSS or INTU, the rankings didn’t change much at all, while for others like FRSH and IOT their ranking dropped significantly.
 A big drop in the rankings for a company indicates to us that its Rule of 40 ranking is driven more by financial engineering (how employee compensation is financed) than its peers. The questions for you are, does that change your view of the company? How much are you willing to pay for a Rule of 40 company that is primarily there because of how they’ve decided to finance their employees’ compensation?
Of the 14 companies in Exhibit 2, we found eight of them (AVPT, BILL, FRSH, IOT, KVYO, NTNX, WDAY and ZM) have talked about the Rule of 40 (not surprisingly using different “profit” margins, including non-GAAP operating, free cash flow and adjusted free cash flow) in their earnings calls or discussed it in their filings over the past year, for example:
- Workday Inc. (WDAY) - CEO, Carl Eschenbach, touted earlier this year that it’s a “rule of 40 company.”
- Nutanix Inc. (NTNX) – CEO, Rajiv Ramaswami, led off his letter to the shareholders in the 2024 proxy noting that NTNX “became a rule-of-40+ company again.”
- Freshworks Inc. (FRSH) - CFO, Tyler Sloat, stated earlier this year that they “are very focused on getting to the Rule of 40 by 2025” and then proceeded to exceed it in both Q1 and Q3 of 2024. But if you adjust for stock comp the 43% Rule of 40 result in Q3 drops to just 12%.
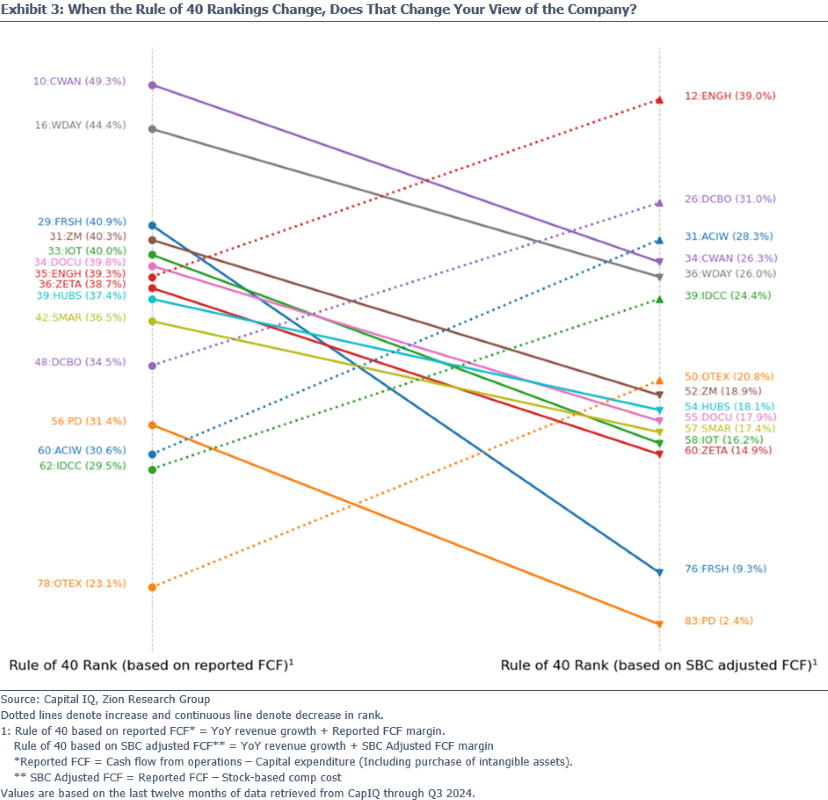
We ranked all of the companies in our universe based on the more traditional version of the Rule of 40 and then reranked them after making our SBC adjustment, the movement in the rankings was quite extensive. We found 39 companies where their rankings dropped, 45 where they increased and 14 where they remained the same. Exhibit 3 highlights the ten companies with the largest drop in ranking along with the five companies that had the biggest increase in ranking. Should you pay the same multiple for a Rule of 40 company when its ranking drops significantly after adjusting for SBC costs?
The Market Should Reward a Rule of 40 Result Differently if it’s Driven by Financial Engineering
The reason that this all matters is because it seems like the market rewards companies that are at or above the Rule of 40 with higher valuation multiples (e.g., here’s a link to a McKinsey study on the topic). The question is whether the market makes any distinction between those companies with a higher quality Rule of 40 versus those with a lower quality Rule of 40?
In Exhibit 4, we take a quick look at the median market cap to revenue multiples based on the Rule of 40 rankings. Notice that the top quartile ranked companies get a multiple that’s greater than those in the bottom quartile, whether or not the Rule of 40 has been adjusted for SBC (though the spread does narrow when we adjust for SBC, maybe the market still has some sorting to do).
In the top quartile we see the SBC adjusted Rule of 40 companies garnering a bit higher multiple than if ranked under the more traditional metric, does that indicate the market is rewarding a higher quality Rule of 40? On the other end the bottom quartile companies are also getting a higher multiple after we adjust for SBC costs, could that indicate that there are some lower quality Rule of 40 companies that the market still needs to take a closer look at? 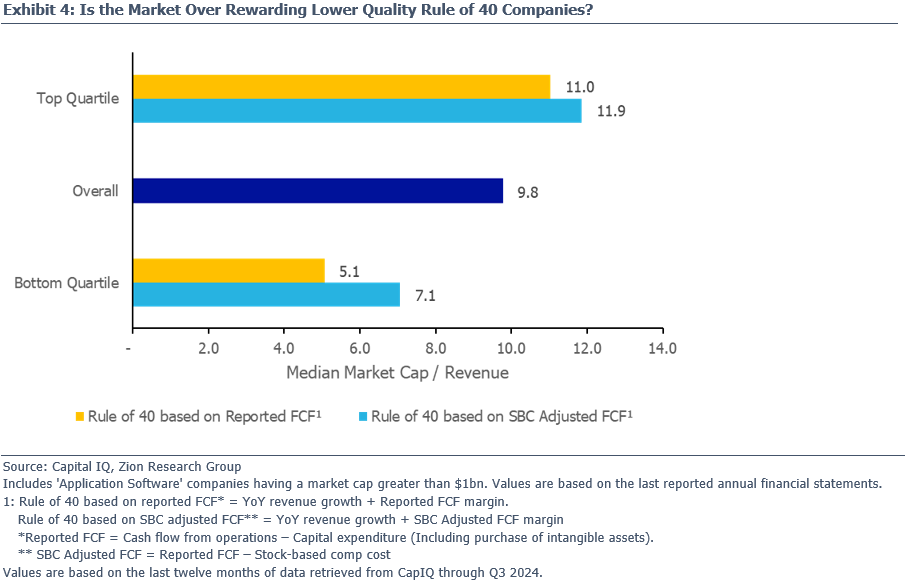
Even the FASB is Keepin’ an Eye on KPIs
We’re not the only ones thinking about KPIs, your friendly neighborhood accountants in Norwalk CT (aka the FASB), recently issued an invitation to comment on Financial Key Performance Indicators for Business Entities. The FASB asked a series of questions, including whether “Financial” KPIs (which does not include things like churn, same-store sales, number of subscribers, etc.) should be standardized (if so, which ones) and if Financial KPIs should be required or permitted to be disclosed in GAAP financial statements.
In theory standardizing KPIs sounds like a good idea, but in reality, if the FASB heads down this path we’d expect to see companies respond by providing a lot more “adjusted” KPIs. We think that the IFRS rules on MPMs (management defined performance measures) are a pretty good starting point, require companies to describe how the MPM is calculated, reconcile it to the most comparable GAAP metric (including the tax impact of each reconciling item) and communicate any changes made to the MPM.
 Our two cents is that the FASB might want to first tighten up the basics, like better defining operating income and operating cash flow before it tries to define EBITDARPO. Even more basic, the Board needs to take a step back and ask if its accounting model still works for today’s companies; like the lack of information provided around the biggest investment many companies make nowadays, R&D, and their largest asset, intangibles. While they are at it, how about more of a focus on providing decision useful information for investors and less of a focus on accounting rules and disclosures that make preparers (i.e., companies) and their auditors happy. Ok, we’ll get off our soap box now.
Shameless Plug
You are super busy! Let us take stuff off your plate. For example, we can help with your KPI analysis, whether it’s having a look at KPI quality, trying to reconcile KPIs to the financial statements, making sure that KPIs are truly comparable across the companies you care about (basing it on the label does not do the trick), evaluating whether the definitions have changed over time, diving into the proxy to see how KPIs influence executive comp plans, checking whether the adjustments made to arrive at the KPI are legit or not, etc.
Take care,
Dave
 Heck even the letters in the acronyms stand for different things, take ARR, is it annual run rate, annualized renewal run-rate, annual run-rate revenue, annualized exit monthly recurring subscriptions (should probably be AEMRS), annualized recurring revenue, annualized recurring run-rate, or the most popular annual recurring revenue, etc. We have an idea, for those companies looking to have their KPI’s really stand out, why not base them off slang terms, for example, SKIBIDI (Sales Keep Improving Business Is Doing Incredible) or Star Wars characters, C3PO (Cumulative Positive Profit Potential is Outstanding)?
 Whether or not you agree with how we’d suggest treating stock comp, our analysis may provide some insight into the quality of the Rule of 40 results. The closer the traditional Rule of 40 amounts are to our SBC adjusted ones the more it appears to be driven by the underlying business, the higher the quality of the metric, all else equal. On the other hand, the wider the gap between the traditional and SBC adjusted Rule of 40 amounts the more it appears to be driven by financial engineering (i.e., how employee compensation is financed), the lower the quality. Which then begs the question (for you to answer), if what appears to be an impressive Rule of 40 result is built on the back of financial engineering does that deserve a lower multiple?
 We applied our thought process to each of the 98 (North American) Application Software companies with a market cap greater than $1 billion. As you can see in Exhibit 1 the number of companies meeting or beating the Rule of 40 drops from 33 (nearly 34% of the total) to just 11 (only 11% of the total). Don’t hesitate to reach out to us if you’re interested in seeing the list of those 11 companies that meet the Rule of 40 under both methods.
 A big drop in the rankings for a company indicates to us that its Rule of 40 ranking is driven more by financial engineering (how employee compensation is financed) than its peers. The questions for you are, does that change your view of the company? How much are you willing to pay for a Rule of 40 company that is primarily there because of how they’ve decided to finance their employees’ compensation?


 Our two cents is that the FASB might want to first tighten up the basics, like better defining operating income and operating cash flow before it tries to define EBITDARPO. Even more basic, the Board needs to take a step back and ask if its accounting model still works for today’s companies; like the lack of information provided around the biggest investment many companies make nowadays, R&D, and their largest asset, intangibles. While they are at it, how about more of a focus on providing decision useful information for investors and less of a focus on accounting rules and disclosures that make preparers (i.e., companies) and their auditors happy. Ok, we’ll get off our soap box now.