Buyback Barometer
Deep inside of a parallel universe
It’s getting harder and harder to tell what came first - Red Hot Chili Peppers, Parallel Universe
Stock buybacks have been getting more attention recently (so has the weather, why are there so many tornadoes?), with a number of companies stepping up repurchases in the first quarter, the S&P 500 companies spent $204 billion buying back their stock in Q1, that’s up 4.5% YoY. In addition, there’s been a bunch of new buyback authorizations, like Apple’s plan to buy back $110 billion of its stock and just yesterday GM announced a new $6 billion buyback.
With the added attention comes the usual storyline that all stock buybacks are, in the immortal words of Tony the Tiger, Grrreat! That’s because buybacks reduce the share count, which boosts earnings per share and the stock price (if only it were that easy).
 With stock buybacks among the largest investments that some companies make, we suggest analyzing them a bit more critically from the perspective of the remaining shareholders. If the company paid less than intrinsic value for the repurchased shares it made a good investment, if it paid more, it made a bad investment (not a new concept, Warren Buffett has been talking about if for years).
In this piece, we dust off our buyback analysis and take a look at the buyback returns for the companies in the S&P 500 to try and find the winners and losers. Our plan is to release the Buyback Barometer on a quarterly basis going forward.
Evaluate Buybacks Like Your Own Portfolio
S&P 500 companies invest hundreds of billions of dollars per year in their own shares, but are they all good investments? How do you judge? We suggest evaluating them like a portfolio manager measures their performance. Treat the buybacks as if the company were buying shares for a portfolio, take into account dividends (that they don’t have to pay) and measure the returns over time. Then compare those returns to a relevant benchmark, ideally the company’s cost of capital.
If the returns beat the cost of capital, it made a good investment (indicating it has been paying less than intrinsic value for the shares which adds value for the remaining shareholders through a wealth transfer from those that sold). If not, it’s a bad investment (indicating it has been paying more than intrinsic value, destroying value for the remaining shareholders through a wealth transfer to those that sold). If the returns happen to equal the cost of capital, that signals shares were bought back at intrinsic value and no wealth was transferred (value neutral).
Of course, you’d also need to consider the company’s balance sheet/cash flows (does it have the liquidity/resources to part with the cash), what did it cost to finance the purchase and what other investment opportunities were available (e.g., if it could generate better returns elsewhere, that’s where it should put its capital to work).
Buyback Winners & Losers
We took a crack at evaluating the buybacks for the S&P 500 companies. Using the monthly share buyback data for each company (from the beginning of 2014 through March 31, 2024, that’s a lot of datapoints), factoring in dividends and a number of simplifying assumptions (e.g., we assume buybacks take place mid-month) we built hypothetical portfolios for each company. We then measured the internal rate of return (IRR) using the March 31, 2024, closing price.
In the spirit of measuring buyback performance in the same way you’d measure the performance of your portfolio, Exhibit 1 shows the top ten buyback winners and losers over four different time periods, one year, three year, five year and ten year (or life to date if shorter).
.png)
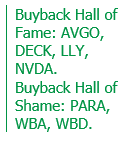 If there were a buyback hall of fame, Broadcom Inc. (AVGO), Deckers Outdoor (DECK), Eli Lilly (LLY) and Nvidia (NVDA) could make a strong case for admission as they show up in the winner’s circle for all four time periods. On the other hand, Paramount Global (PARA), Walgreens Boots Alliance (WBA) and Warner Bros Discovery (WBD) are vying for entry into the hall of shame by appearing in the loser’s circle four times.
Most S&P 500 Buybacks Adding Value
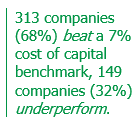 We estimate that over the past ten plus years, 408 S&P 500 companies or 88% had a positive return on their buybacks while only 54 or 12% had negative returns (those 54 companies spent nearly $417 billion buying back their stock); 38 companies had no buybacks. The results start looking a bit different when you change the benchmarks. For example, if you use high grade bond yields as the benchmark, 94 companies or 20% miss the mark. If we were to benchmark against a cost of capital of 7%, we find 149 companies or 32% underperform, while 313 companies or 68% beat the benchmark.
In Exhibit 2, we plot the buyback returns for each company against the change in diluted share count over the past ten years. You can see there’s not much correlation between whether companies are increasing/reducing their share count, and the buyback returns.
.png)
Over the past ten plus years it looks like more buybacks in the S&P 500 have added value (good) for the remaining shareholders than destroyed value (bad). But keep in mind our analysis is highly dependent upon the closing price on March 31, 2024; if you think stocks were overpriced on that day, less value may have been added than our analysis depicts and vice versa.
Buyback Sector Benchmarks
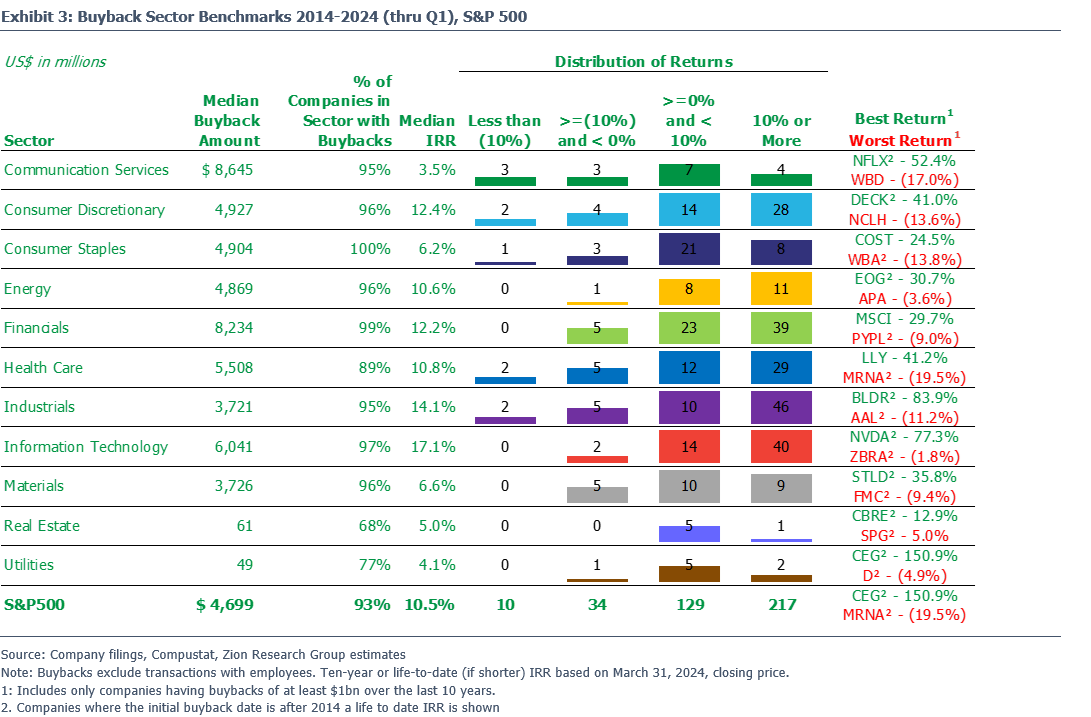
Looking for benchmarks to see how well/poorly the companies you own/follow stack up against their peers? Check out Exhibit 3, where we provide another view of the analysis by sector. We also show the company with the best and worst return on their buybacks for each sector. For the S&P 500, the crown goes to Constellation Energy Corp (CEG), which spent $1.5 billion buying back its stock generating an IRR of nearly 151%. At the other end of the spectrum is Moderna (MRNA) which spent $5.3 billion buying back its stock destroying value to the tune of a negative 19% IRR.
Big Investment in Buybacks, How’s the Performance?
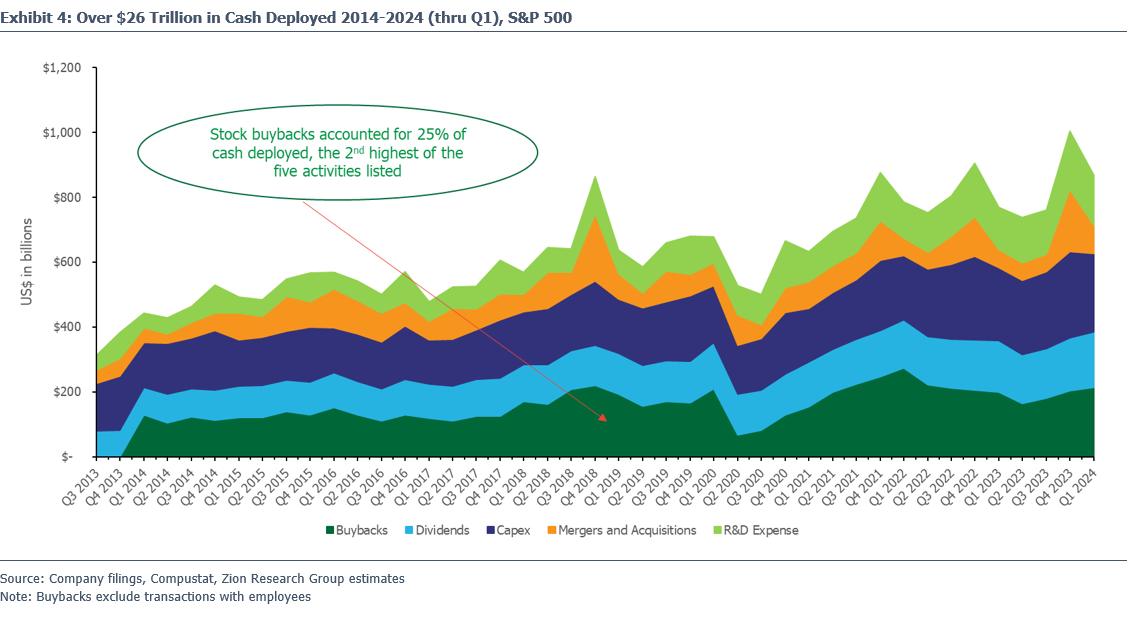
Since the beginning of 2014, the S&P 500 companies have deployed more than $26 trillion in cash to five activities. The highest proportion of that was devoted to capex (28%), followed by stock buybacks (25%), dividends (19%), R&D (15%) and M&A (13%). See Exhibit 4 for the quarterly breakdown of cash deployed for the S&P 500.
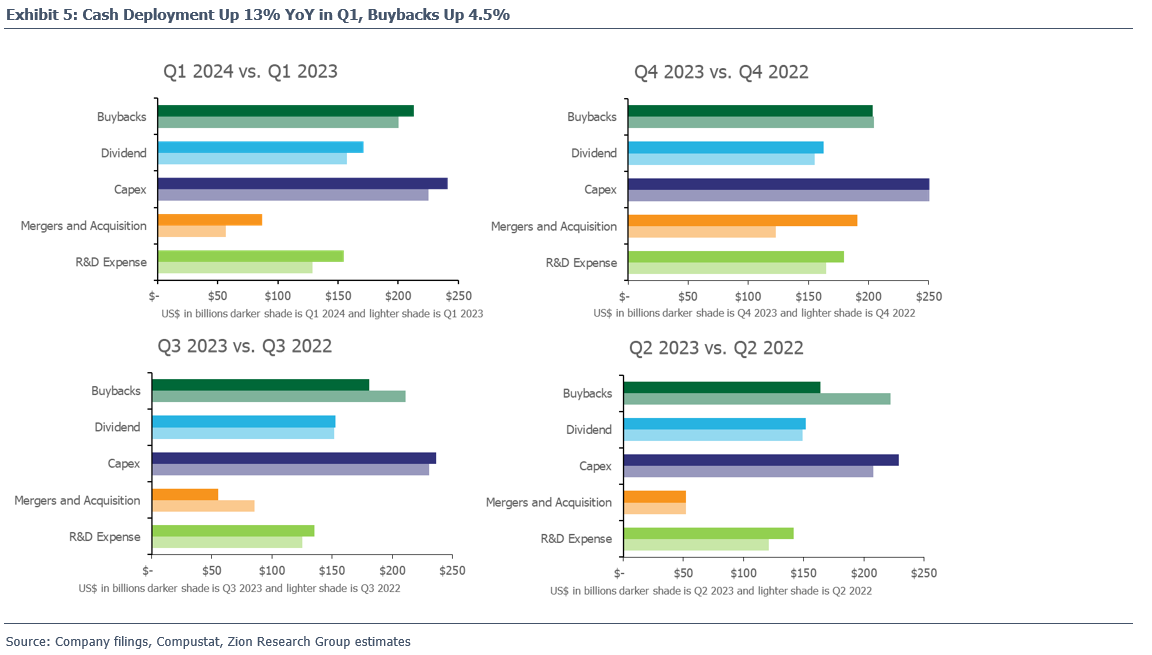
If you’re curious about more recent changes in cash deployment check out Exhibit 5. Where you can see that the S&P 500 companies stepped up spending across the board in the first quarter, deploying $867 billion of cash (up 13% YoY), including $204 billion spent on share repurchases (up 4.5% YoY). The five companies with the biggest YoY increase in buyback spending during Q1 were: Meta Platforms (META) up $5.4 billion, Apple (AAPL) up $4.4 billion, Caterpillar (CAT) up $4.2 billion, Cigna Group (CI) up $3.1 billion and Altria Group (MO) which went from no buybacks in Q1 2023 to $2.4 billion in Q1 2024.
S&P 500 Companies Spent Over $6.6 Trillion Buying Back Stock
So, what does the data tell us about buyback activity? In Exhibit 6, you can see aggregate buybacks for the S&P 500 by month for ten years starting in 2014 through 2024 Q1. Note how buybacks tend to rise with stock prices. Though last year was a different story as buybacks fell YoY in each month despite the index moving higher. Does that tell us something about management’s view of the business, cash flow generation, etc.?
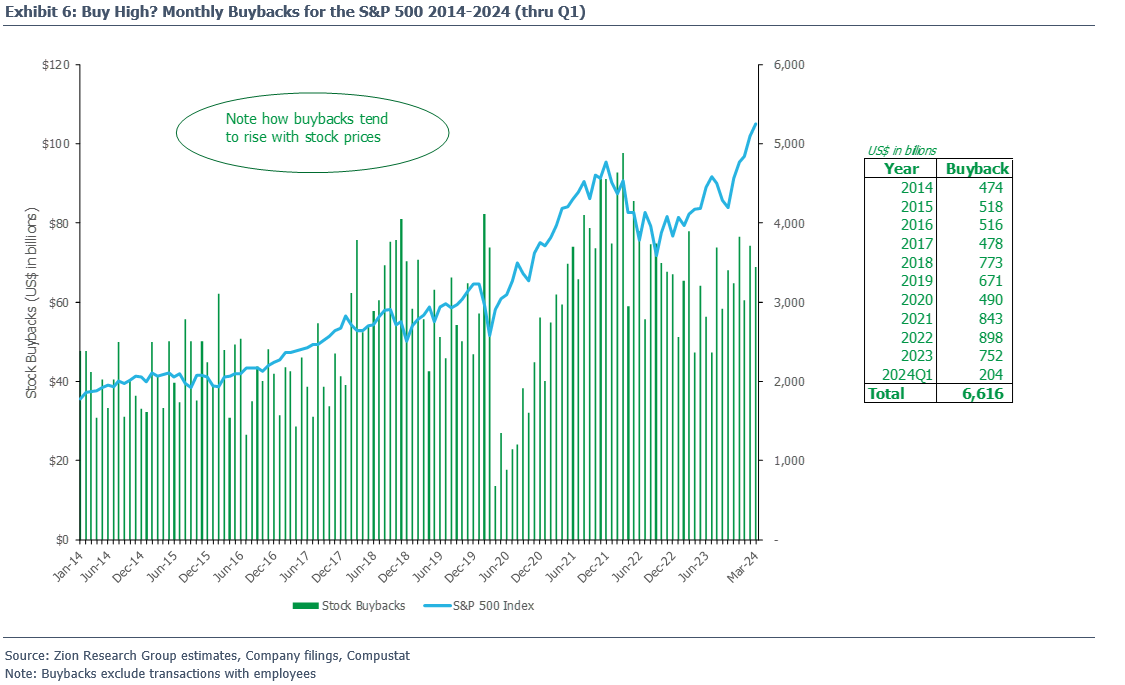
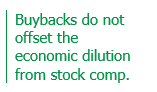 But buying high is the exact opposite of what corporate finance theory and common sense would tell you (buy-low, sell-high). So, why do companies do it? Stock-based compensation is a key driver. Companies buy back more and more stock as stock prices rise to try and offset the increasing earnings dilution from stock-comp. Of course, those buybacks don’t have any impact on the economic dilution that still takes place (unless the repurchases were done on the same date the shares/options were granted).
Buybacks Are Concentrated
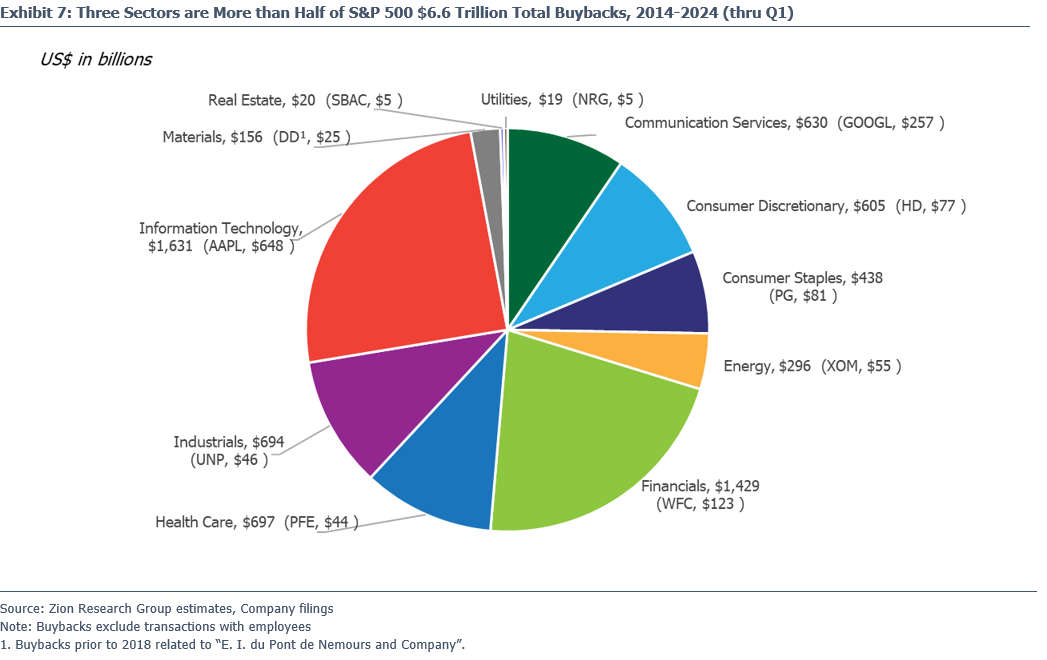
You can see in Exhibit 7 that the spending on buybacks varies quite a bit by sector. Just three sectors, Information Technology, Financials and Health Care, account for nearly 57% of total buybacks for the S&P 500 over the past ten years.
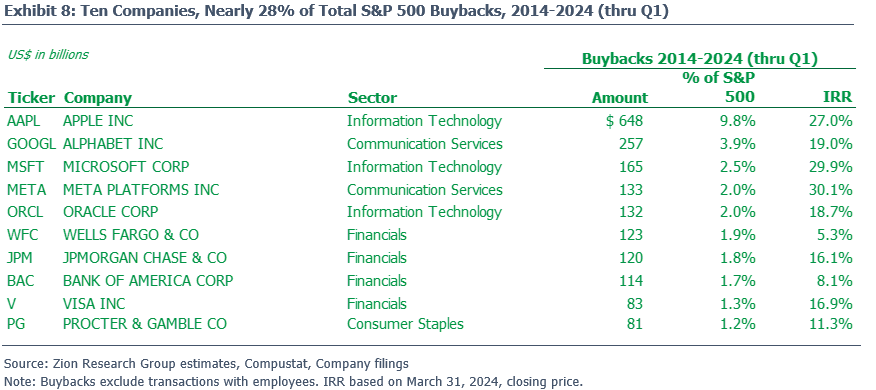
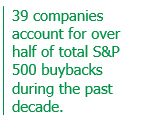 We continue to see the concentration in buybacks at the company level, with 39 companies accounting for over half the S&P 500 total, including the ten companies in Exhibit 8 that make up nearly 28% of total buybacks. On the surface it looks like the buybacks for this group of big spenders on their own shares have mostly been value add, of course you’d want to compare those returns to their cost of capital (we’re looking at you Wells Fargo).
Keep an eye out for more from us on buybacks. Our plan is to release the Buyback Barometer quarterly. We’ll also take a look at what impact they’ve had on EPS growth (keep in mind that even if they boost EPS, buybacks can destroy value for the remaining shareholders).
.png) You are super busy! Let us take stuff off your plate. How are you monitoring whether the buybacks for the companies you own/follow have added or destroyed value? You try to evaluate their other investment decisions thru metrics like ROIC, what about buybacks? Our Buyback Barometer can help you track the performance of this significant investment decision and may provide some insight into management’s ability (or lack thereof) to create shareholder value.
You are super busy! Let us take stuff off your plate. How are you monitoring whether the buybacks for the companies you own/follow have added or destroyed value? You try to evaluate their other investment decisions thru metrics like ROIC, what about buybacks? Our Buyback Barometer can help you track the performance of this significant investment decision and may provide some insight into management’s ability (or lack thereof) to create shareholder value.
Take care,
Dave